Graphs
This page shall overview some basics in regards to interpreting data.
Accuracy and Precision
What is the difference between accuracy and precision?
First we shall compare two data sets.
| Set 1 | Set 2 |
| 8 | 6 |
| 12 | 14 |
| 9 | 7 |
| 11 | 13 |
| 8 | 6 |
| 12 | 14 |
| 8.5 | 6 |
| 11.5 | 14 |
| 9 | 7 |
| 11 | 13 |
| Average | Average |
| 10 | 10 |
Both data sets have the same average, a target average of 10.
Does this make them equal? No.
We also take into consideration the standard deviation.
| Set 1 Std. Dev | Set 2 Std. Dev |
| 1.65 | 3.83 |
Though both sets are accurate (They both average to 10), one set is more precise than the other, with a smaller deviation between the values (Std. Deviation).
After this average shall be replaced with mean, or the statistical average
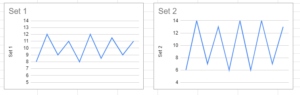
As you can see from the graphs above, the graph for set 1 does not go down or up as far as the graph for set 2 does. This vertical length can be also considered the deviation.
The following sets of data record data sets of a population or batch. Each records how many data points from each set are of a certain number. For each data set, the target is 10.
For reference, imagine 100 bags of candy. Each bag is supposed to have 10 in them, however there is deviance in each bag.
The following two sets record how many bags have certain numbers of pieces of candy. In the first set, the mean is 10
|
No. of Candies in bag
|
No. of bags | |
| Set 1 | Set 2 | |
| 5 | 1 | 0 |
| 6 | 3 | 0 |
| 7 | 8 | 0 |
| 8 | 11 | 1 |
| 9 | 15 | 4 |
| 10 | 22 | 8 |
| 11 | 14 | 21 |
| 12 | 11 | 39 |
| 13 | 8 | 20 |
| 14 | 4 | 6 |
| 15 | 2 | 1 |
| 16 | 1 | 0 |
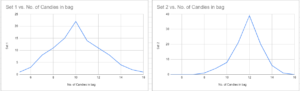
Set 1 is more accurate, as the graph indicates the median is around 10. Graph 2 is more precise, however it is not accurate as the median is supposed to be 10, and it indicates the median is closer to 12.
Standard Deviation and outliers
Standard deviation is the the square root of the sum of each data point minus the mean and squared divided by the number of data points minus 1.
s = sq rt [(sum (x-mean)^2) / (n-1)] replace with better looking
This page is still under construction
needed:
outliers information
How to diagnose issues with:
standard deviation (Accuracy)
outliers
precision